Nullify
Incident management that turns an alert storm into one incident, and won’t let it close until someone writes down why.
- Deployed to EC2 from tag v2.0.0
- FastAPI · PostgreSQL · Redis
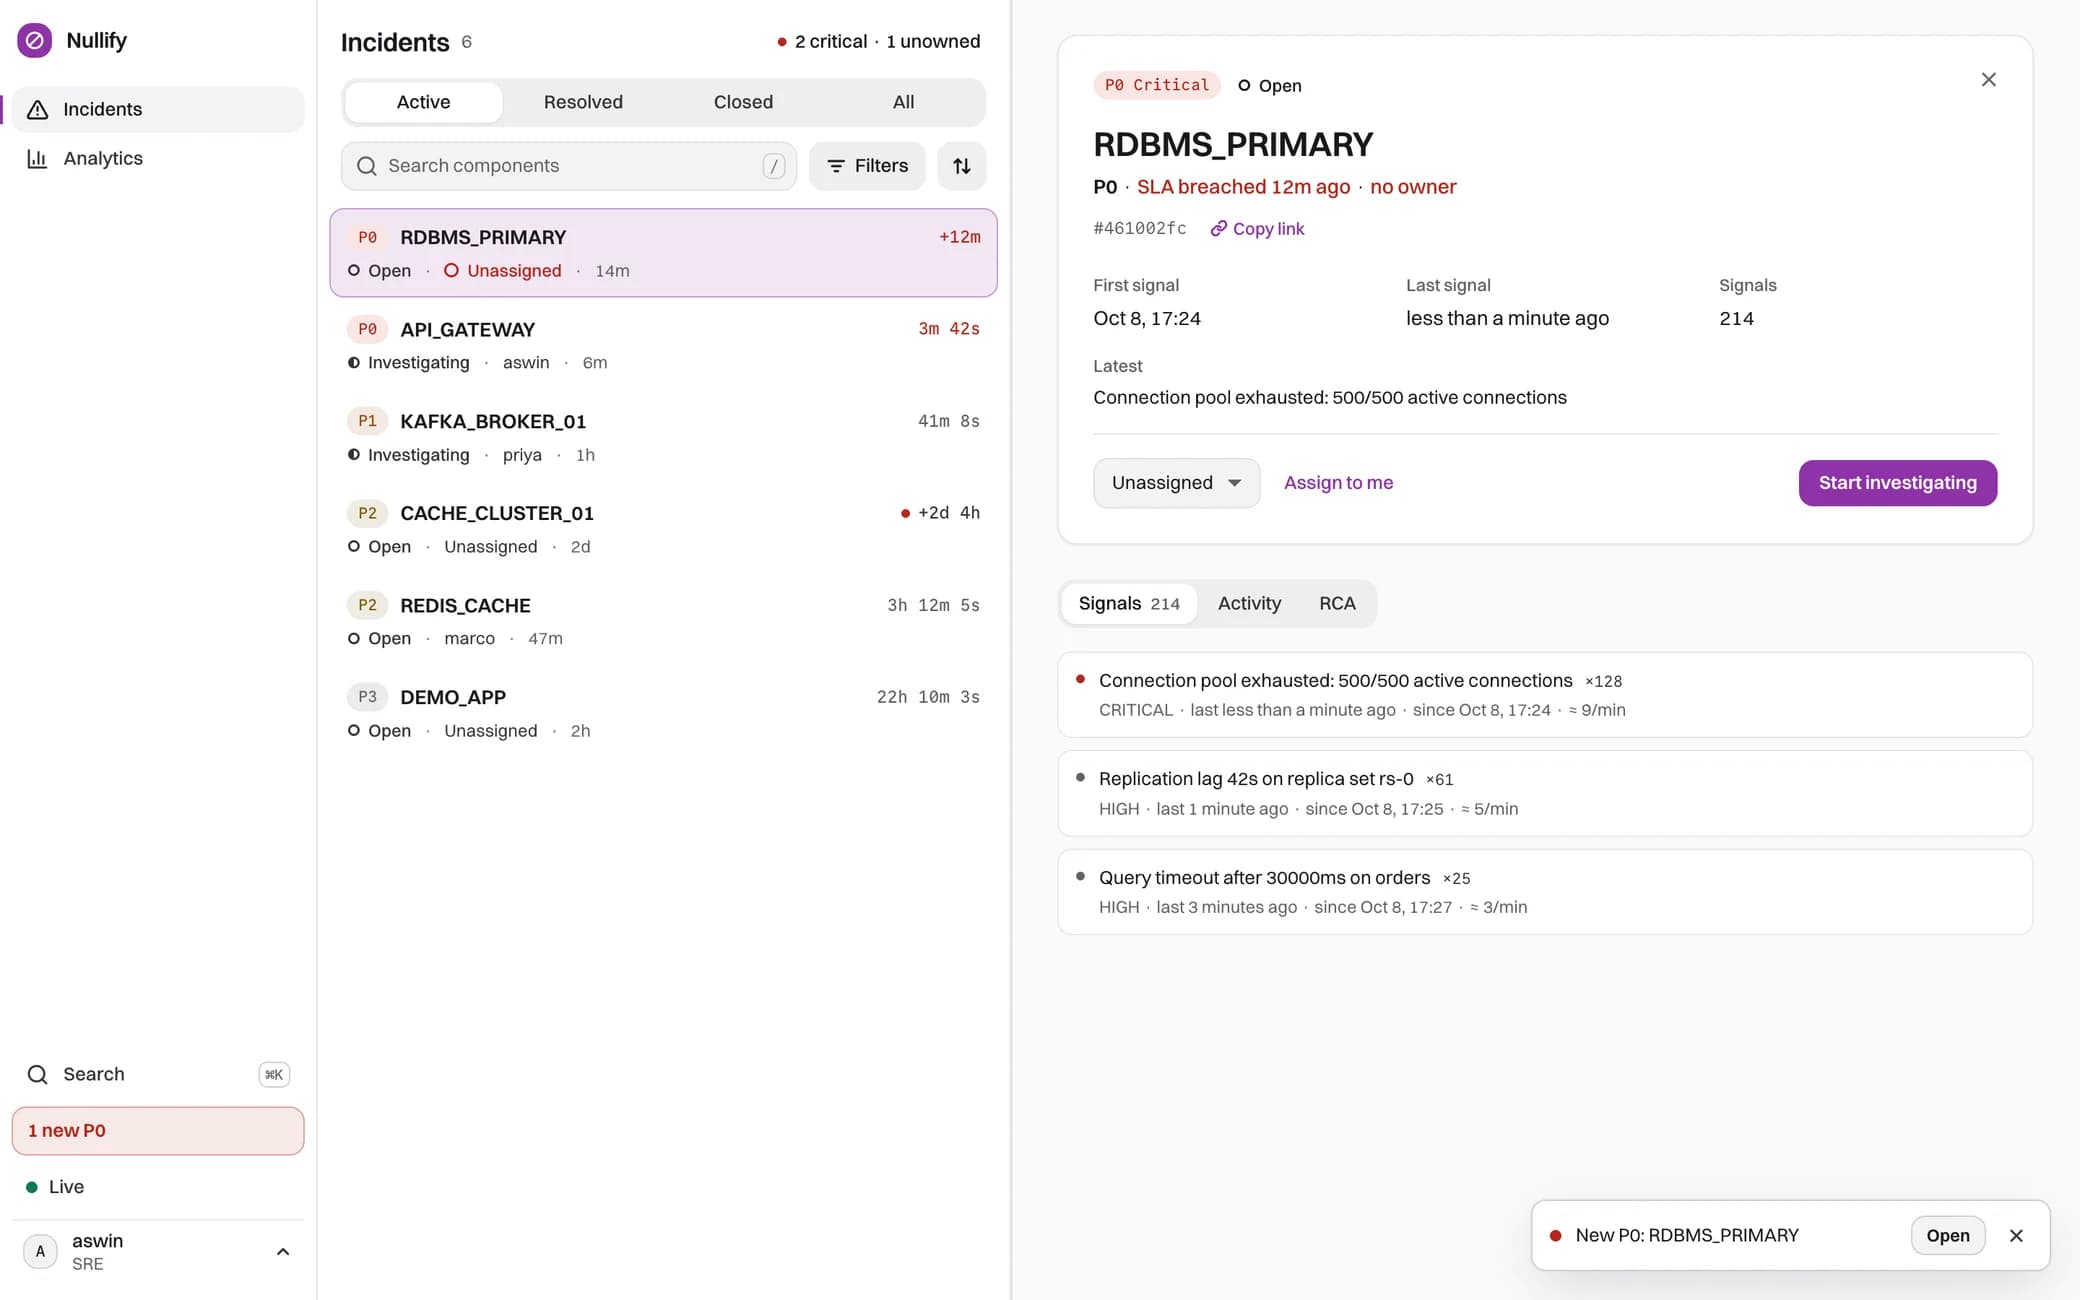
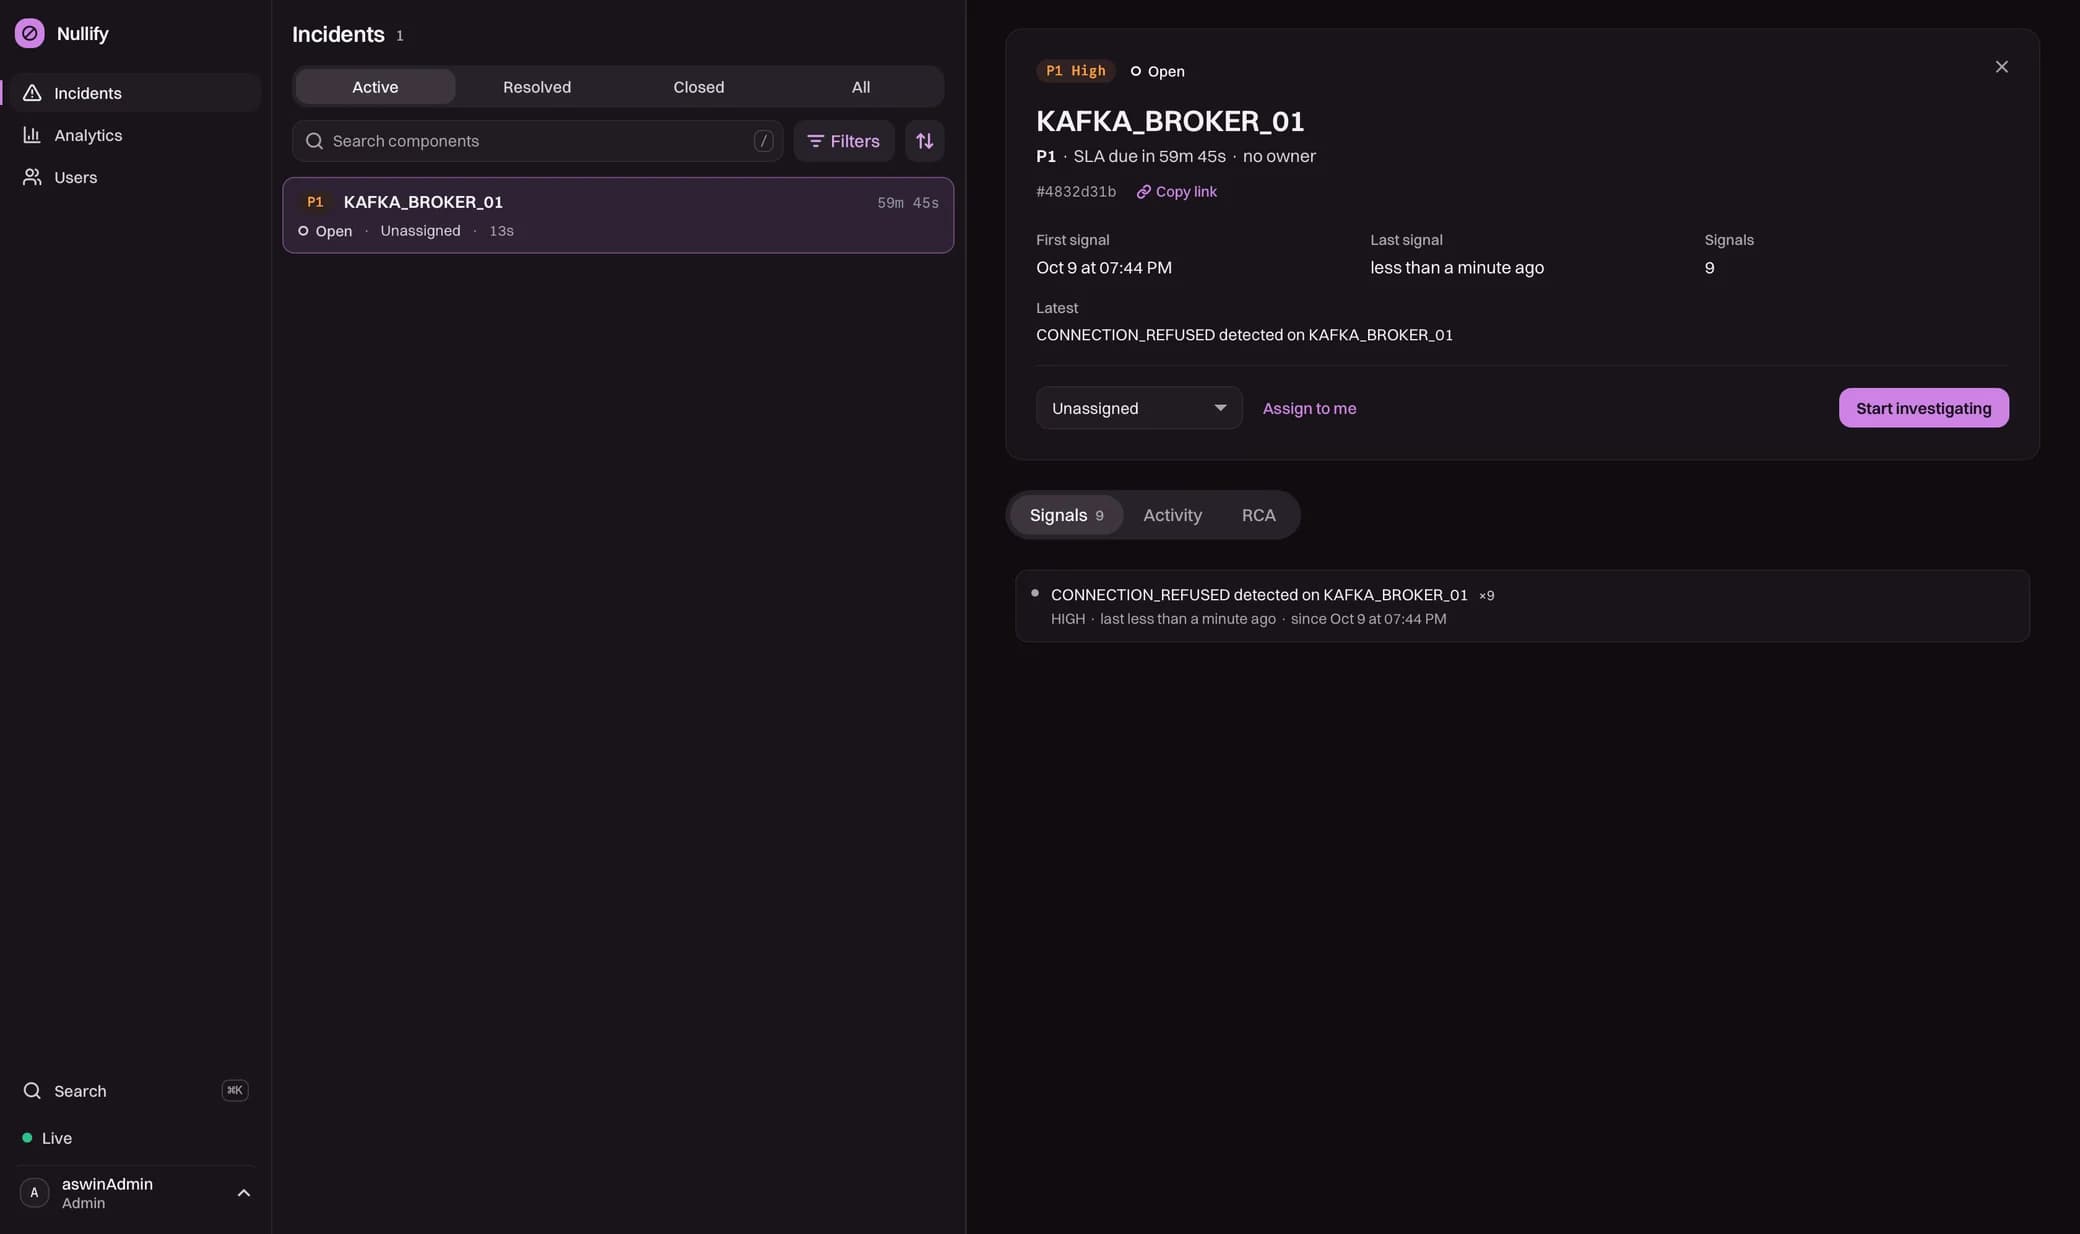
Screens recreated from the app’s source with sample incidents.
One incident, start to finish.
It opens itself.
The first signal for a component opens an incident. The component’s type sets the priority and starts the SLA clock: a database is P0, 15 minutes.
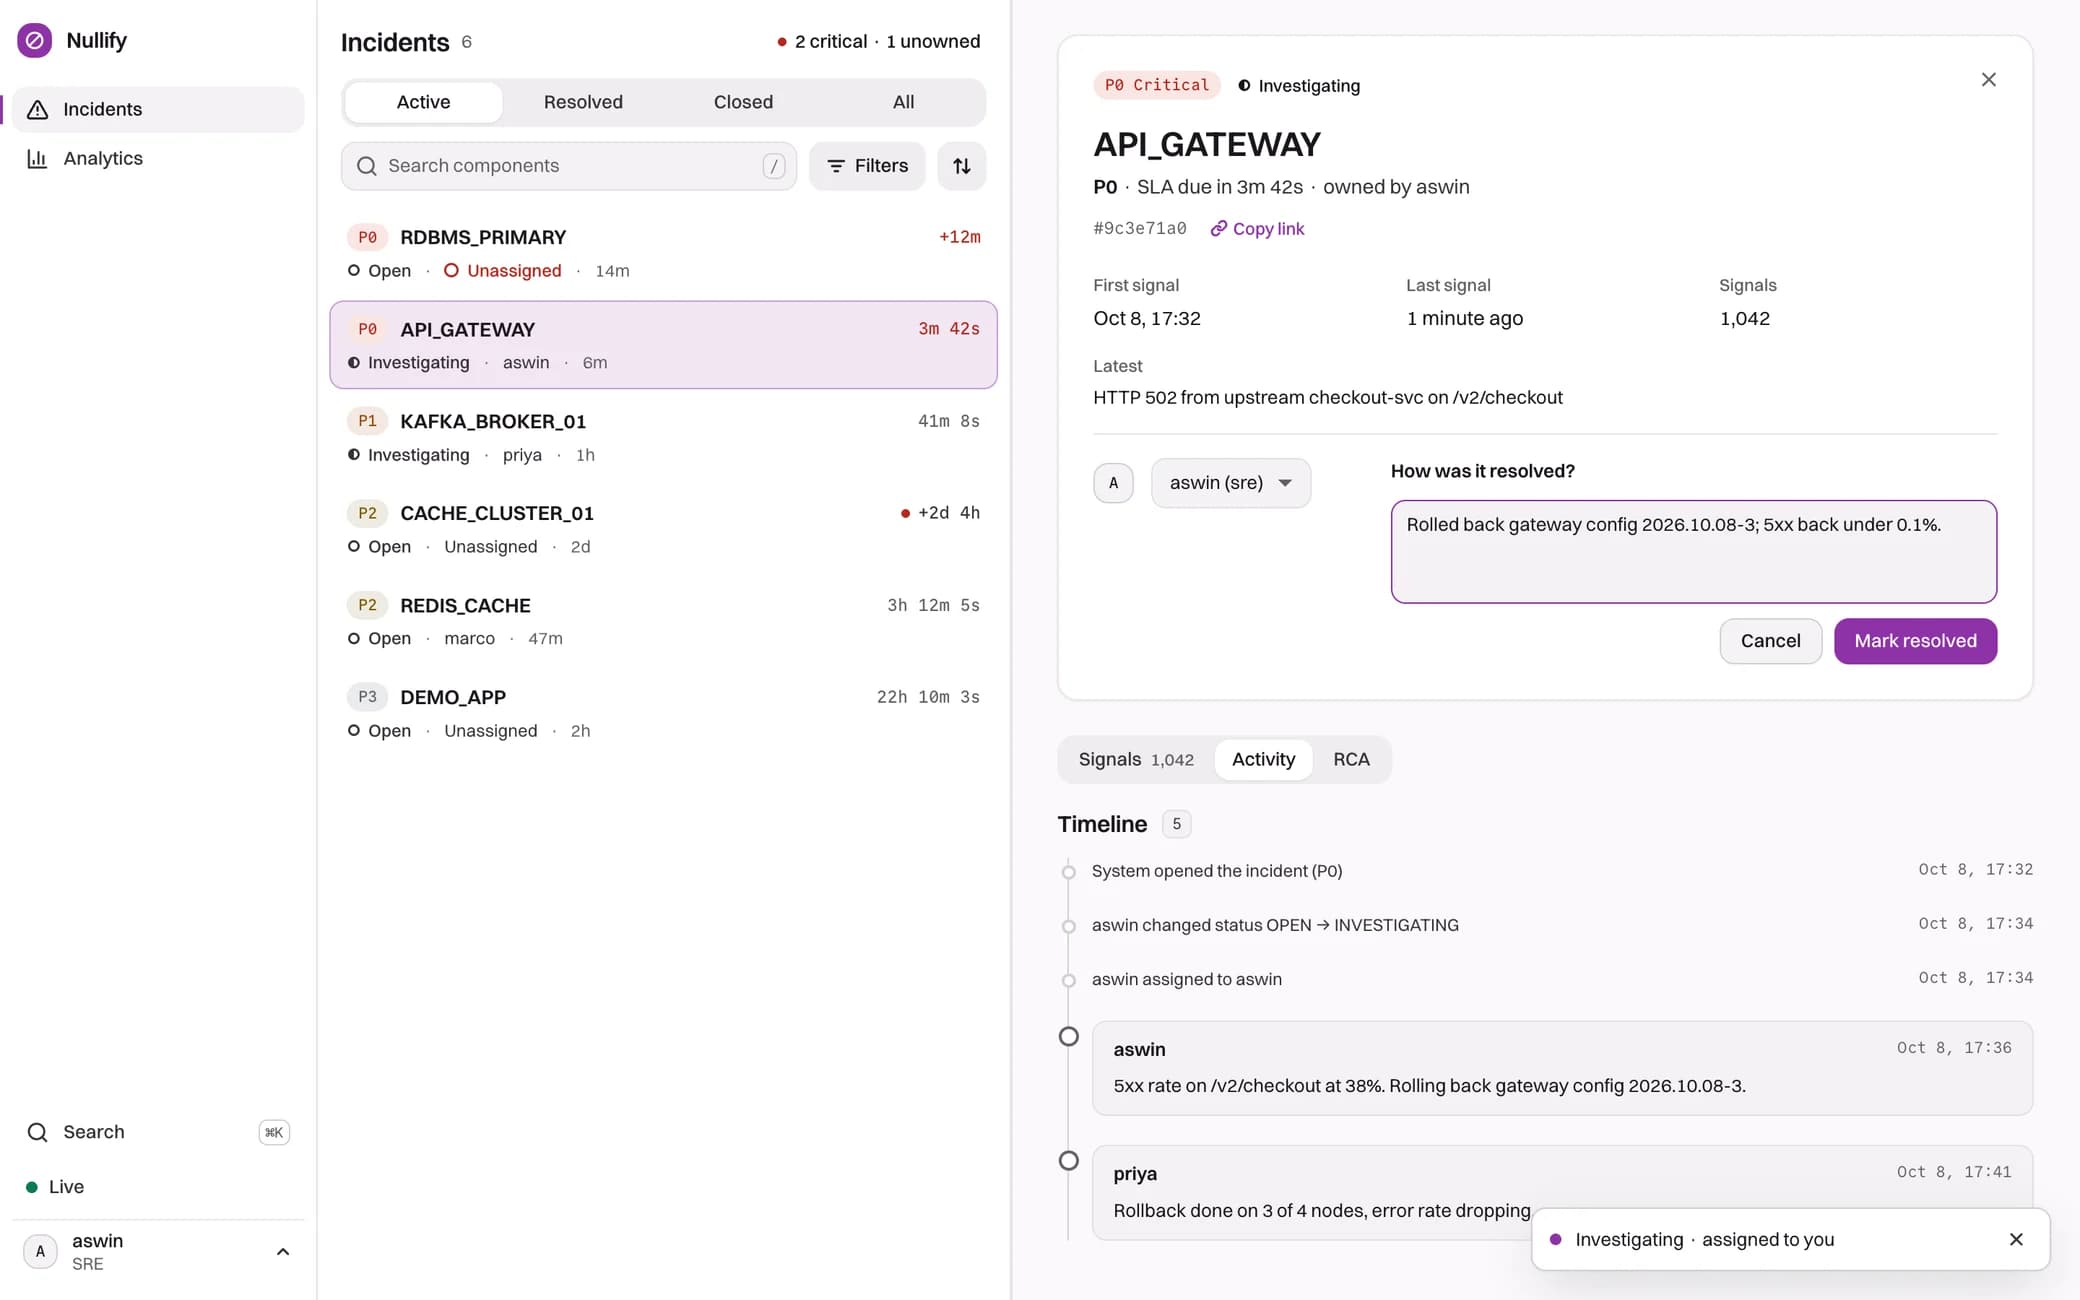
Someone owns it.
Assign it, comment, move it to Investigating. Every change is written to the audit history in the same transaction.
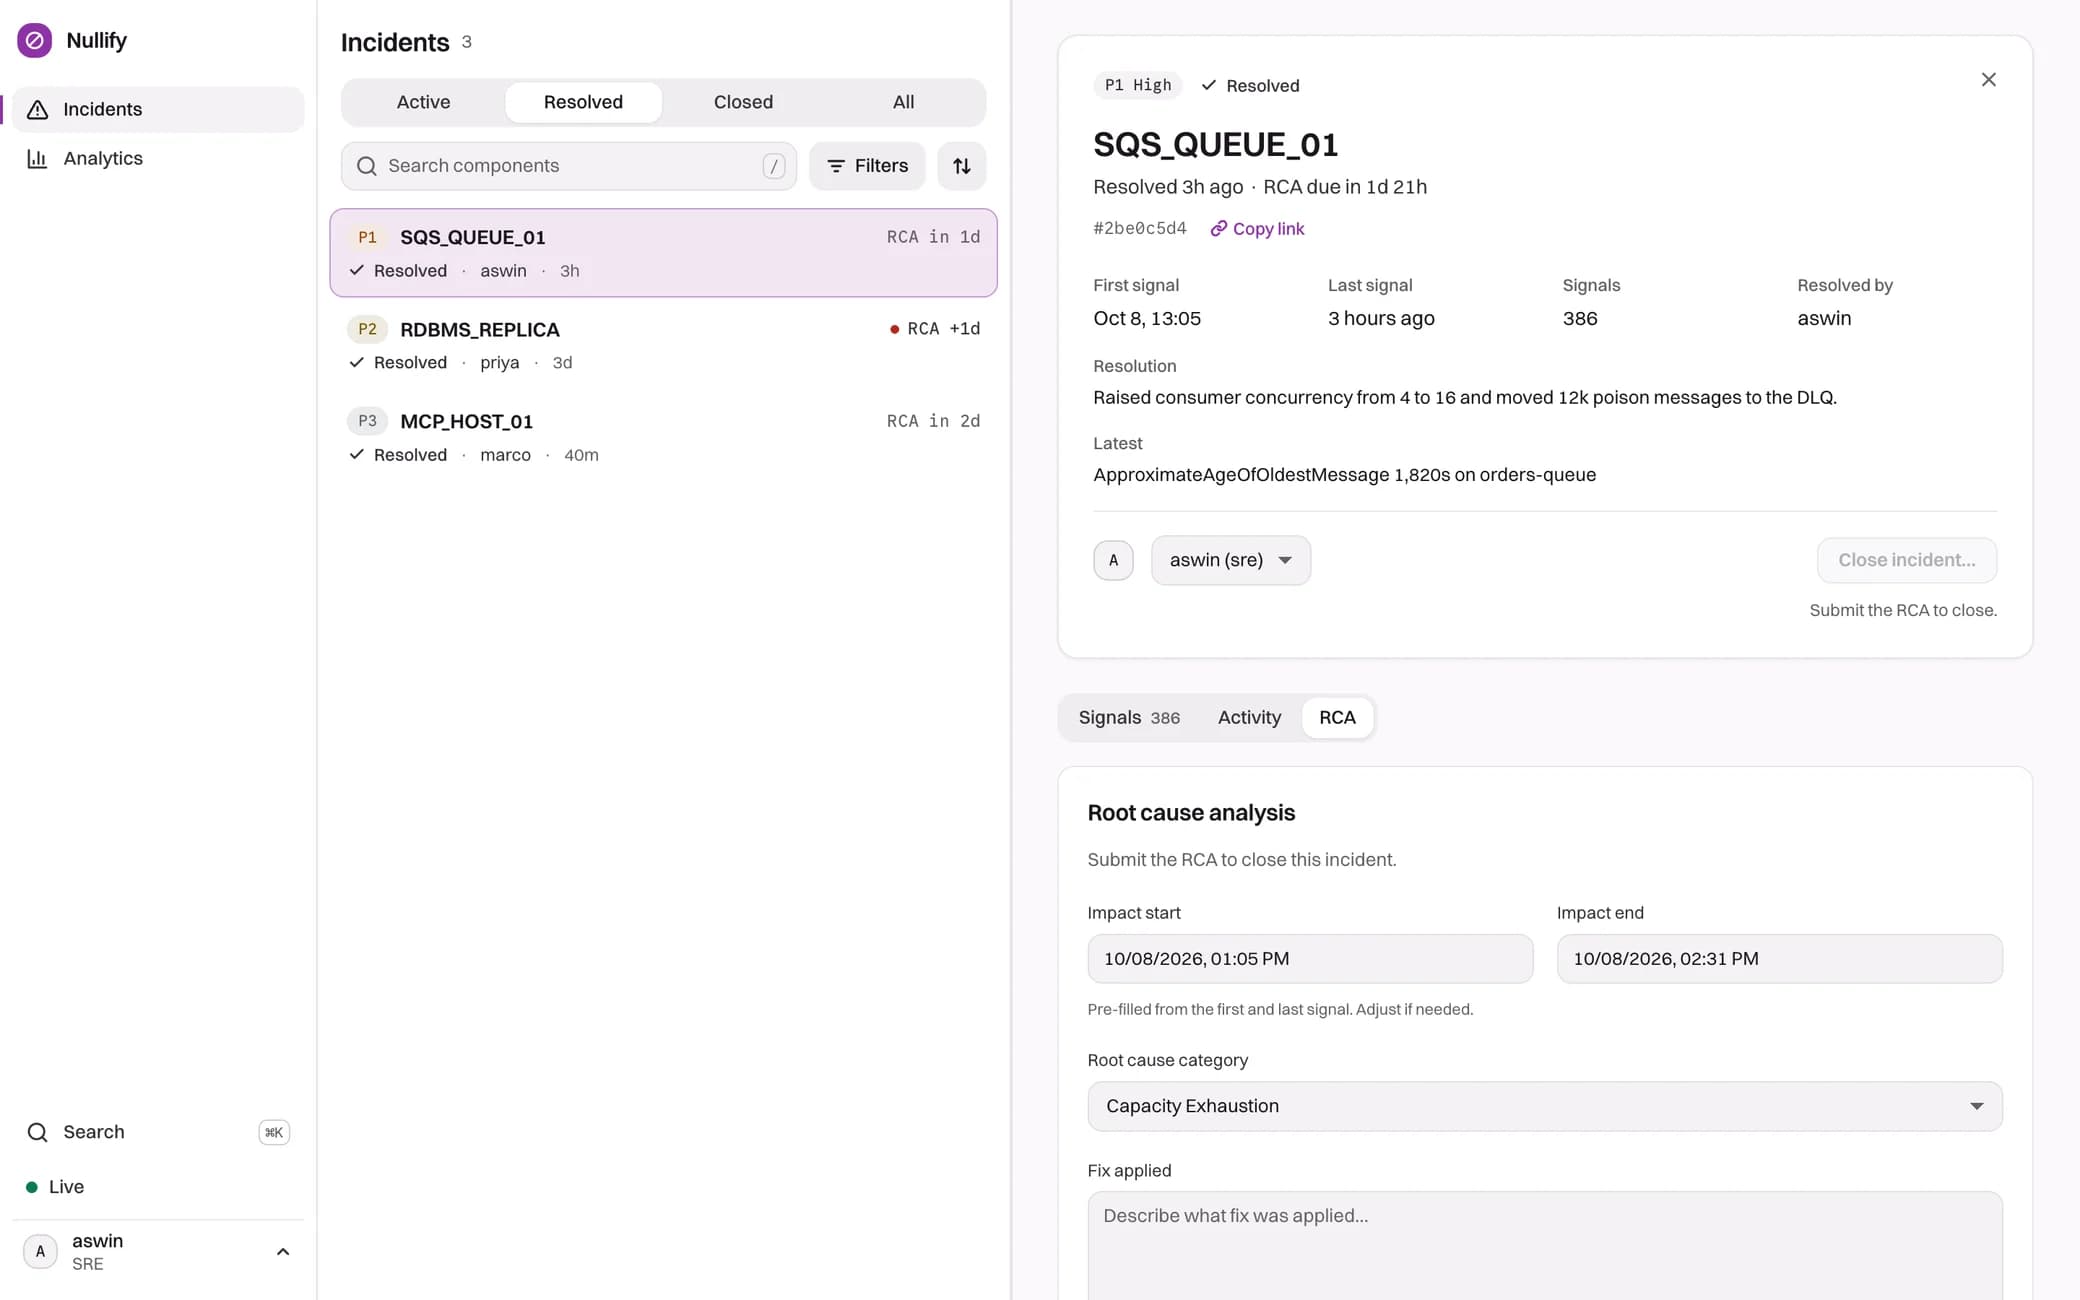
Resolved isn’t closed.
Close stays disabled until the root cause analysis is on file: when the impact started and ended, the cause, the fix, and how to stop it happening again.
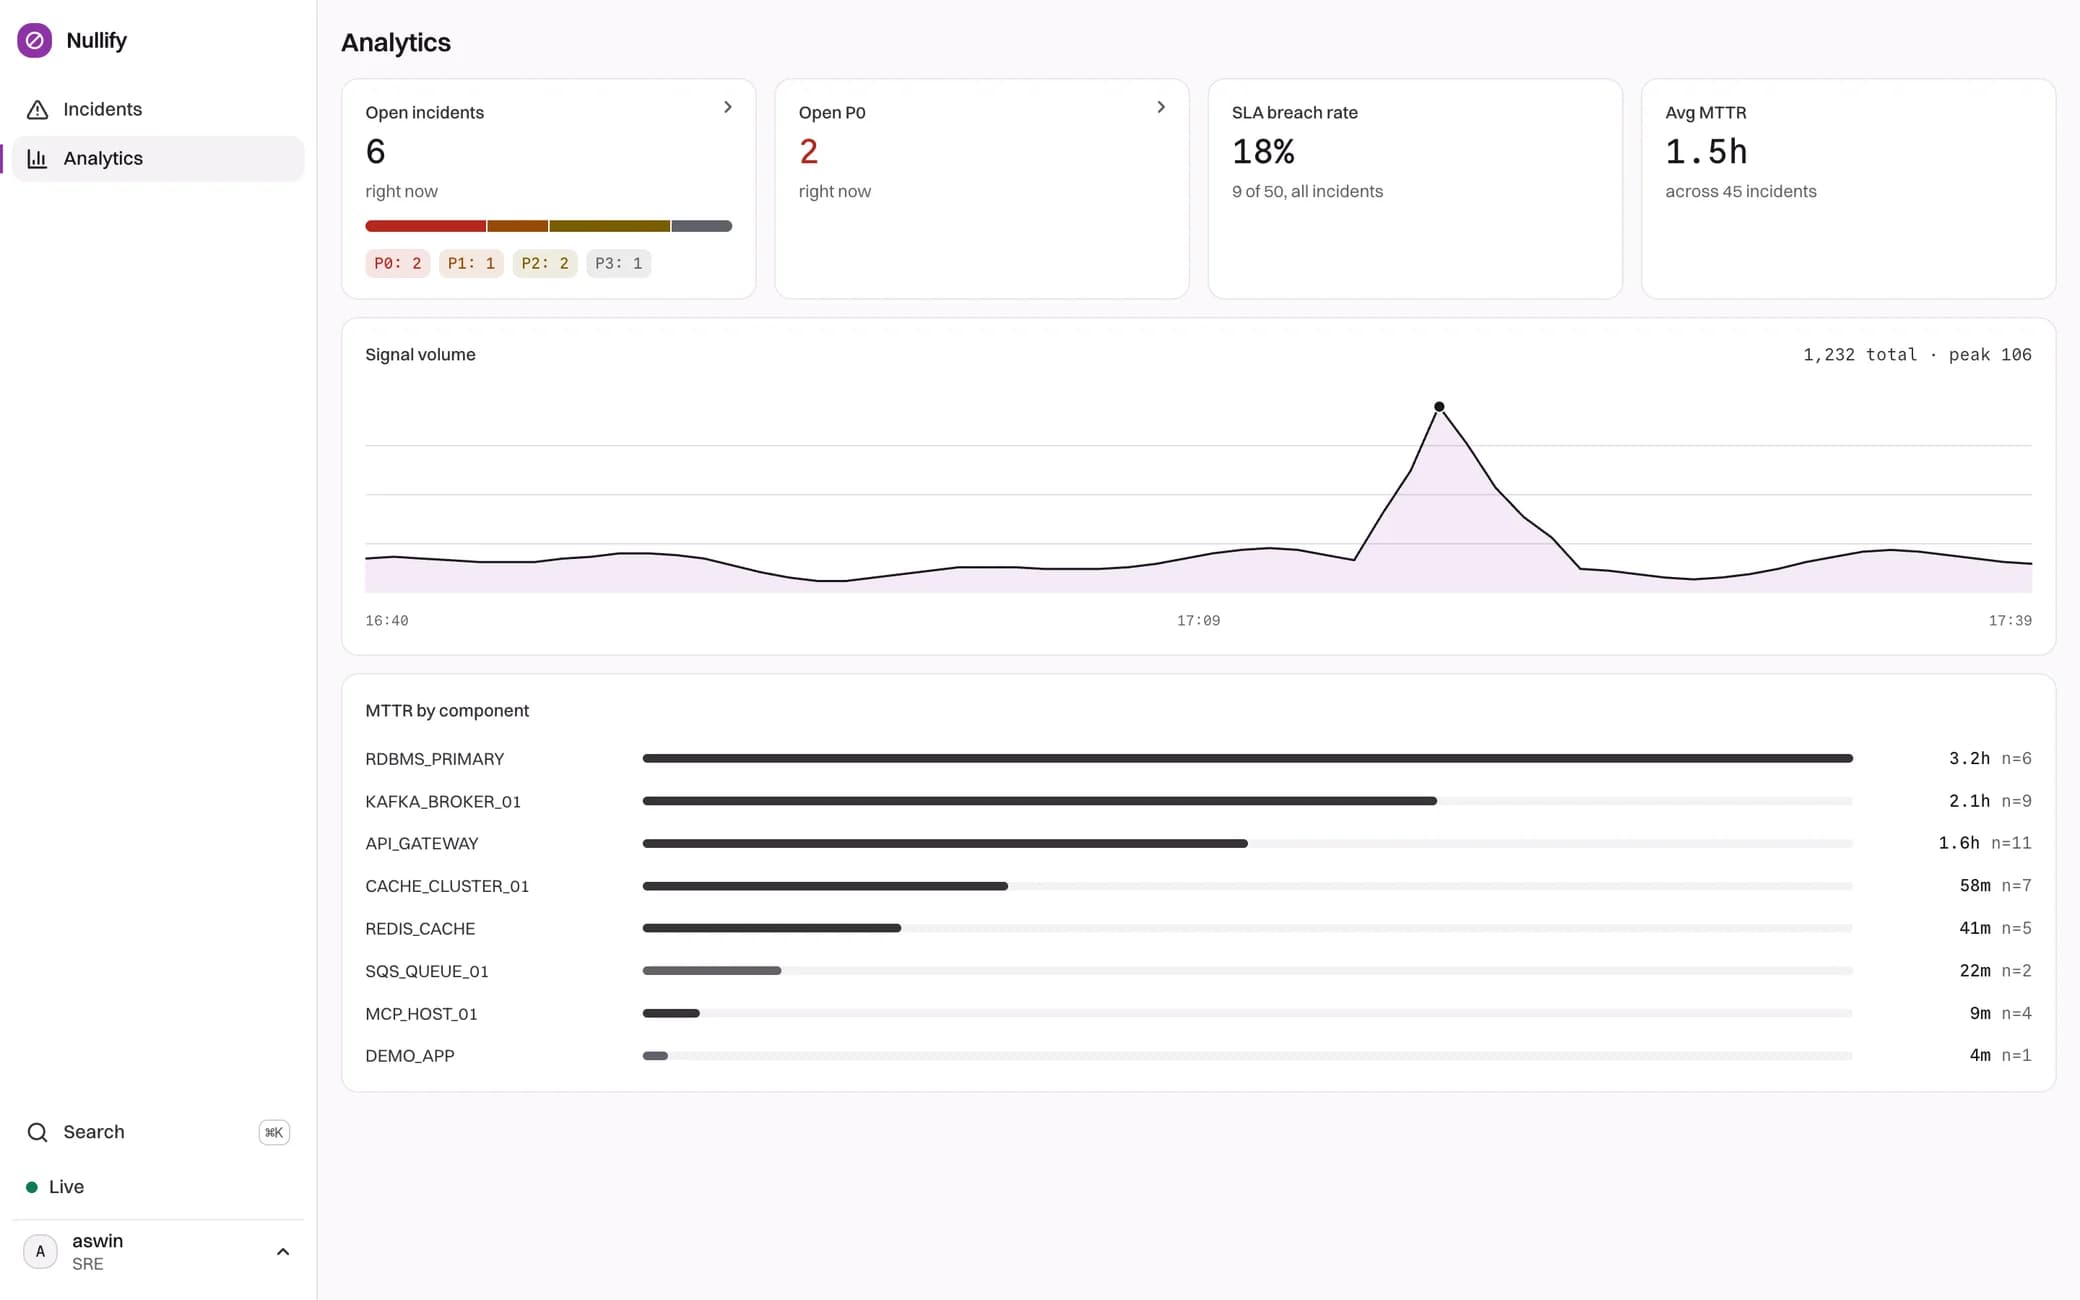
And the team learns.
Filing the RCA records the MTTR, from first signal to RCA. Analytics tracks it by component, beside the SLA breach rate.
On a real server.
Tagged v2.0.0 on 9 October 2026 and deployed to EC2 by the pipeline further down. This is the dark theme, signed in, with test signals.
Orchid, light and dark.
Every colour is read from the app’s orchid.css: one hue in two themes. Severity always carries its label, never colour alone.
Turn alert storms into one clear incident.
Switzer · the whole interface
RDBMS_PRIMARY_01 · SLA due in 14m 32s
A mono stack · IDs, timers, signal names
Light
- background#FBF9FC
- surface#FFFFFF
- border#E3E0E5
- muted#676169
- accent#8E32A7
- text#1B161D
Dark
- background#0F0C11
- surface#19141A
- border#2C262E
- muted#A9A2AB
- accent#CE81E5
- text#F3F1F4
- P0 Critical
- P1 High
- P2 Medium
- P3 Low
- Open
- Investigating
- Resolved
- Closed
Under the hood.
It started from an assignment. In September I rebuilt the core so Postgres, not memory, decides what counts as one incident, and tested it against a real database: 328 tests on the backend, 531 on the frontend.
Start a storm.
A simulation of the two rules at the core, with the app’s own priorities, channels, SLAs and refusal message.
Signals arriving0 / 110
No incidentAll quiet
-
- Linked signals
- -
- SLA
- -
- Notified
- -
- RCA
- -
- OPEN
- INVESTIGATING
- RESOLVED
- CLOSED
All quiet. Pick a component and start a storm.
In the real thing, four worker processes race for the same component. A unique index on open incidents lets only one exist, and the test suite fires 100 concurrent signals and expects exactly one incident.
Measured, not promised.
The first version’s README claimed 10,000 signals a second. Nothing had measured it. When I did, every signal took its own transaction and queued for the same incident row.
The parts.
Only Caddy faces the internet. The database, Redis and the API have no public port, and Grafana is reached through an SSH tunnel.
One EC2 instance running Docker Compose
Edge
- CaddyLet’s Encrypt TLS, HSTS. The only public port
- nginxserves the React app with a strict CSP
App
- FastAPI4 uvicorn workers, REST and WebSocket
Data
- PostgreSQL 16source of truth and audit history
- Redis 7cache and rate limits
Out
- Dashboardslive over WebSocket
Ops
- GitHub Actionstag → images → SSM runs deploy.sh
- Prometheus, Grafana127.0.0.1 only, 11 alert rules
Built by Terraform: EC2, Elastic IP, security group, GitHub OIDC role
Tag it, ship it, watch it.
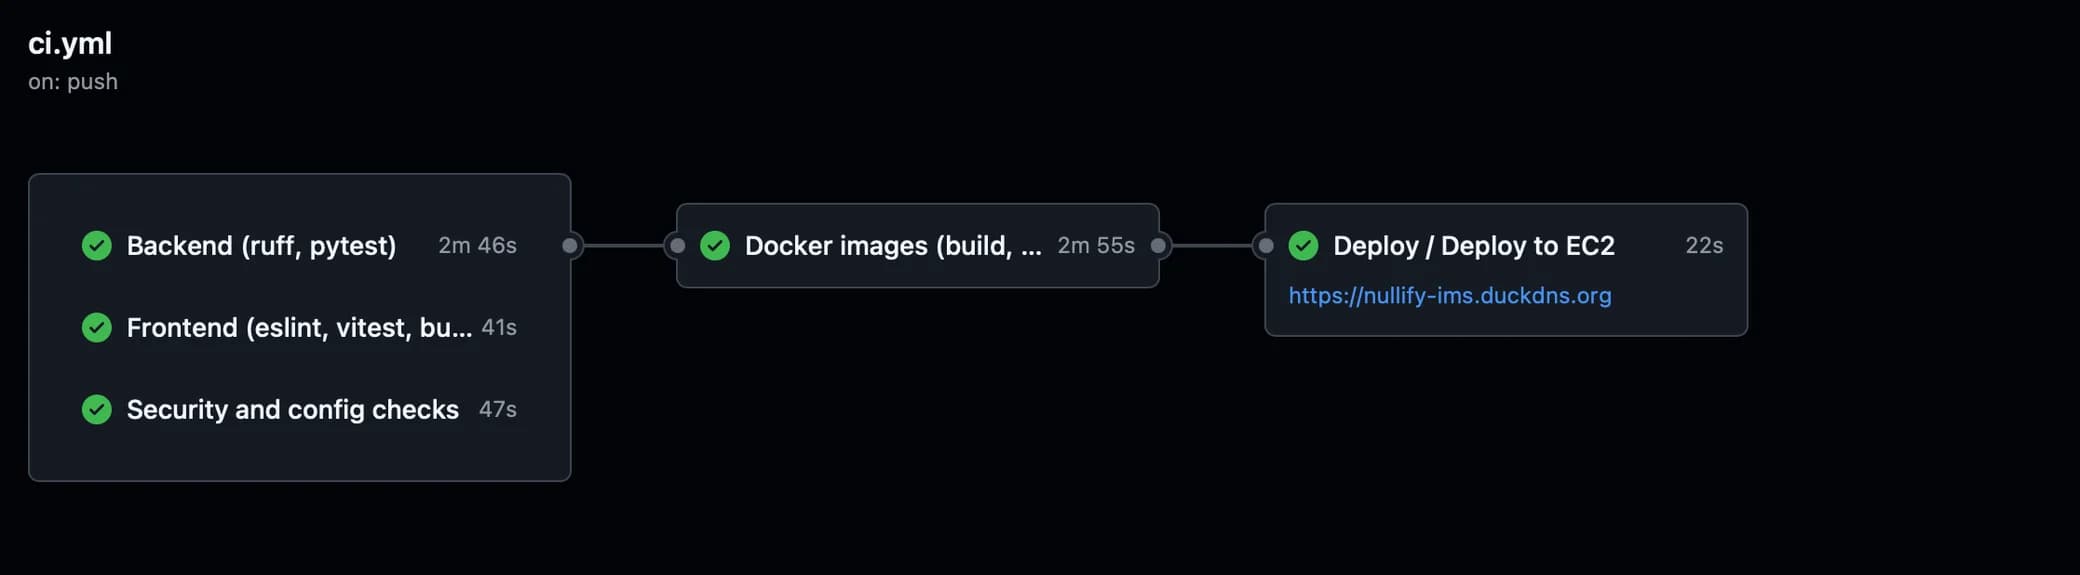
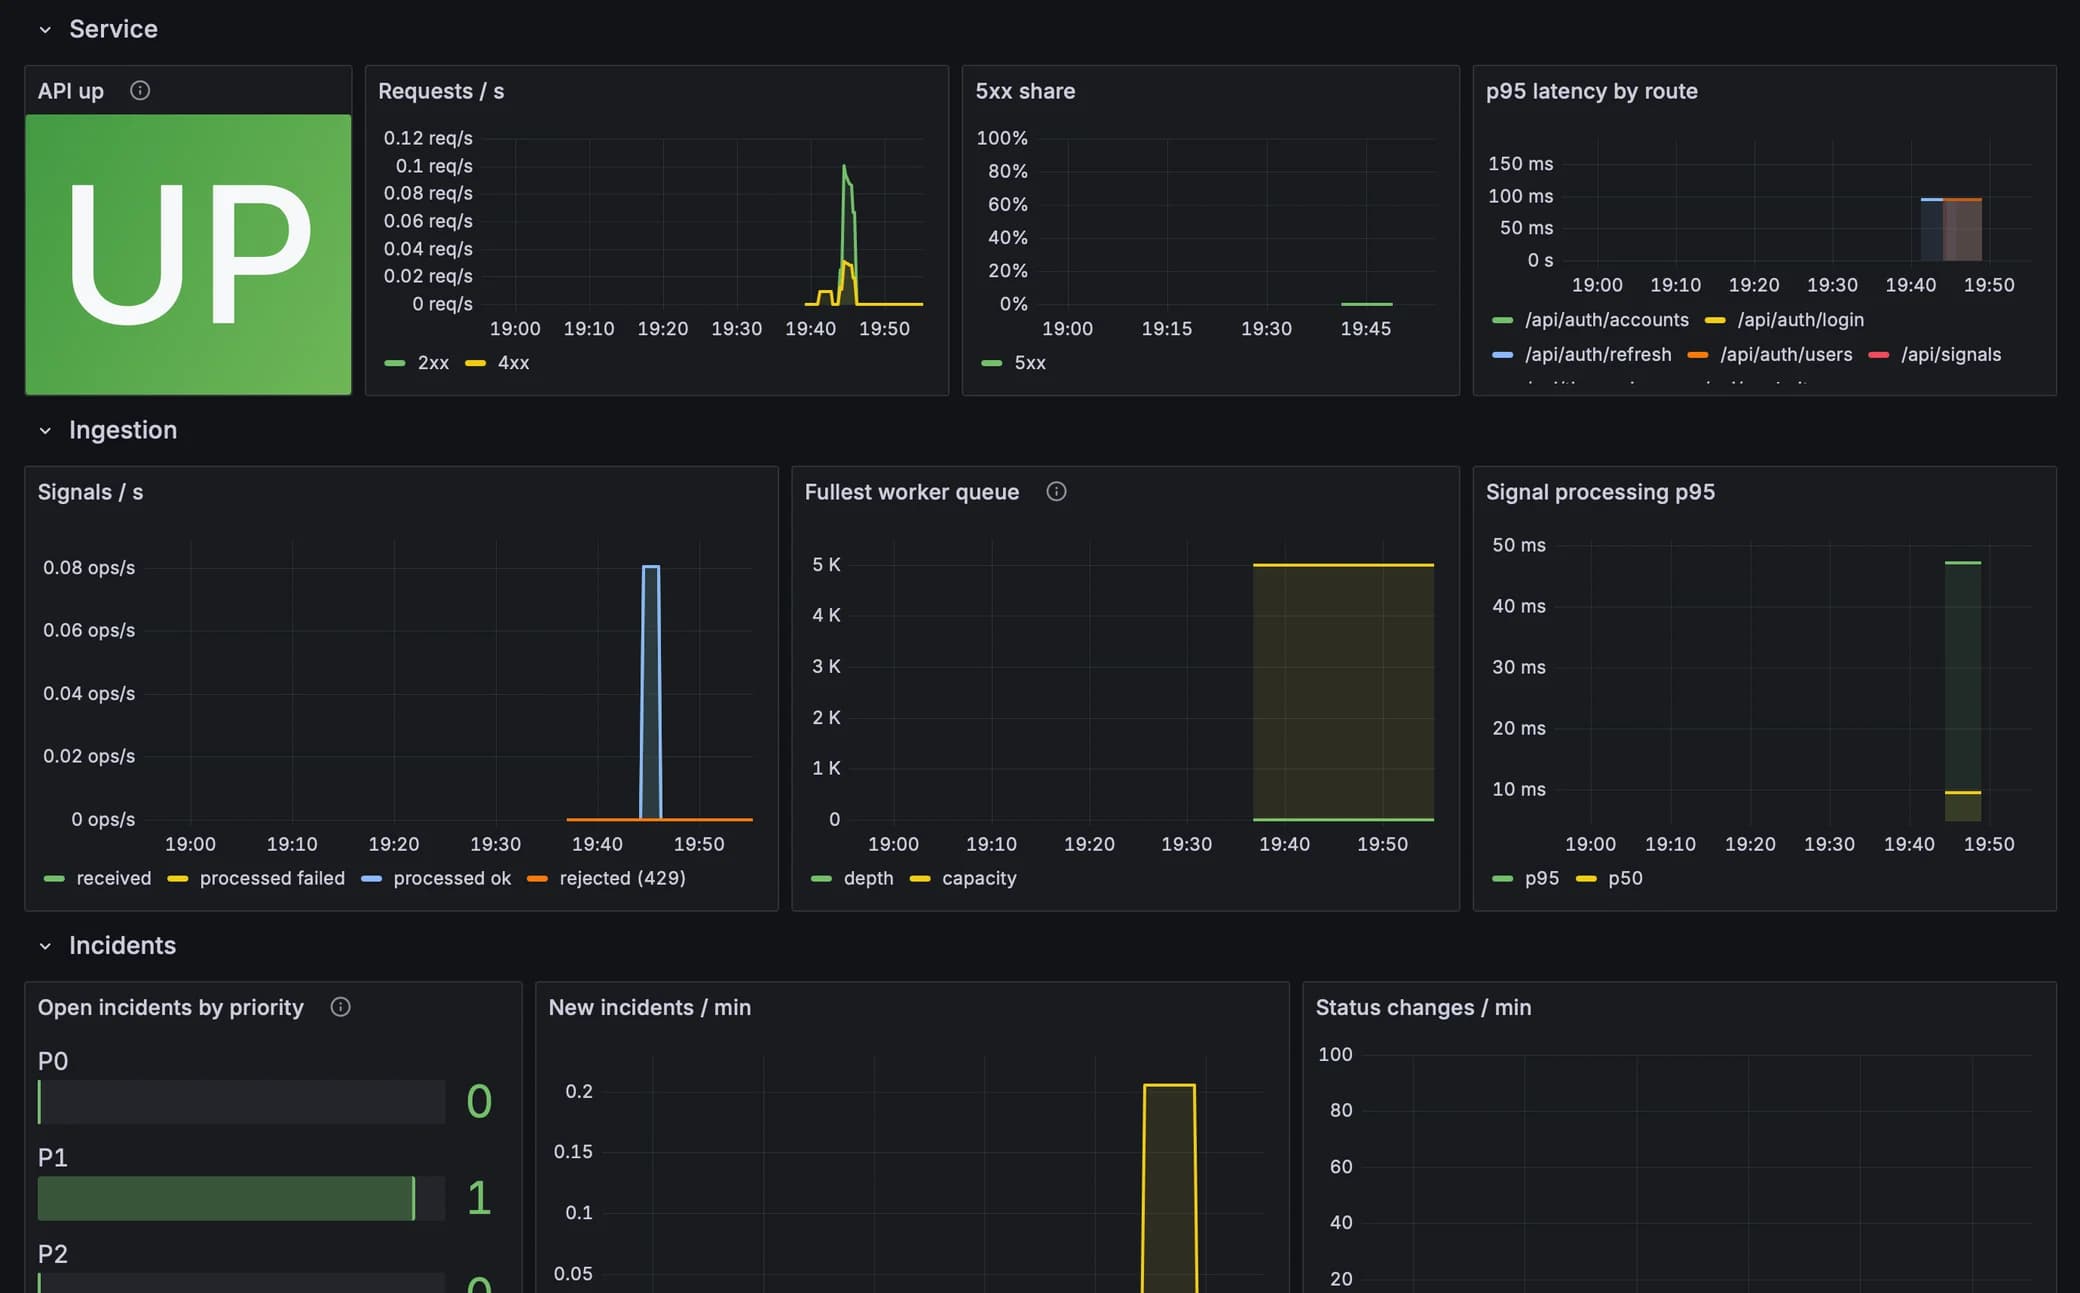
A version tag runs the pipeline, and nothing in CI holds a cloud key. On the server, Prometheus watches the app with eleven alert rules.
- Tag v*Pushing to main runs nothing. A version tag is the release.
- Backendruff, then pytest against a real Postgres. Under 80% coverage fails.
- Frontendeslint, vitest, a production build.
- Securitygitleaks over all history, pip-audit, npm audit, bandit, zizmor, terraform validate, promtool.
- ImagesBuilt for amd64, Trivy fails any fixable high or critical, tagged with the commit, never latest.
- ApprovalThe production environment waits for a click.
- DeployOIDC for a short-lived role, then SSM runs deploy.sh. No SSH, no stored keys.
- HealthHTTPS /health from outside. A failed pull, migration or check rolls back.
The API exports its own metrics: signals received, rejected and processed, queue depth, open incidents, state changes, database retries and failed notifications, summed across all four workers.
- NullifyApiDown
- PostgresDown
- RedisDown
- IngestQueueFilling
- SignalsDropped
- SignalProcessingFailing
- IngestBlockedOnDatabase
- NotificationsFailing
- DbRetriesSpiking
- HighErrorRate
- SlowRequests
What broke.
28 Sep 2026 · Local
Two SREs moved the same incident, and both won.
A status change read the row, checked the move was legal, then wrote by id. Two people at once both passed the check: five requests, five successes. Now the write is compare-and-set, an UPDATE that only lands if the status is still the one it checked, and the loser gets a 409. The first race test passed even on the broken code because its requests never overlapped; it now holds a row lock to force the race.
The commit, 7b8b9171 Oct 2026 · Local
Eight signals, and the live feed stayed empty.
The API runs four worker processes. The request that stored a signal and the browser’s WebSocket usually sat in different ones, and each worker only told its own sockets. Now every worker publishes events to a Redis channel and every worker passes them on, so any open dashboard sees everything.
The commit, b14d46b8 Oct 2026 · Local
A Postgres outage sent 1,878 signals nowhere.
I stopped Postgres under load. Compose drops a stopped container’s DNS name, so the driver raised a lookup error the code treated as permanent: 1,878 of 2,000 signals went to the raw log with no incident, and the API answered 500. Now network errors count as transient, a circuit breaker holds signals and answers 503 with Retry-After, and a replay command recovered 1,875 of the lost ones. The rerun stored 1,500 of 1,500 through a 30-second outage.
The commit, e3d3a329 Oct 2026 · CI
The scanners said all clear.
Gitleaks ran in a container, tripped git’s dubious-ownership check, scanned 0 commits and still printed “no leaks found”. It now scans every commit. Then Trivy found 44 fixable high and critical CVEs in the nginx base image; moving to 1.30 with an apk upgrade took it to 0.
The commit, 0129c50
What I’d do next.
- Automated Postgres backups. Today the database lives on the instance’s own disk.
- Alertmanager, so the eleven alert rules reach a person instead of waiting in Prometheus.
- A second instance. The app already scales sideways (stateless workers, Redis fan-out, the one-incident rule in the database); the infrastructure doesn’t yet.
- A durable ingest queue. A signal that was accepted but not yet written is lost if a process crashes hard.
- Terraform state in S3 before a second person touches the infrastructure.
Tech specs.
- Frontend
- React 19, Vite, HeroUI v3, Tailwind CSS v4, served by nginx
- API
- FastAPI on uvicorn (4 workers), Pydantic v2, WebSocket
- Data
- PostgreSQL 16 (SQLAlchemy 2 async, asyncpg, Alembic), Redis 7, a JSONL lake
- Edge
- Caddy with Let’s Encrypt and HSTS, nginx with a strict Content Security Policy
- Infrastructure
- Terraform: EC2 c7i-flex.large, Elastic IP, security group, GitHub OIDC role, SSM
- Delivery
- GitHub Actions, ruff, pytest, vitest, gitleaks, pip-audit, npm audit, bandit, zizmor, Trivy, Dependabot
- Observability
- Prometheus, Grafana, Postgres and Redis exporters, 11 alert rules
- Tests
- 328 backend against real Postgres (80% coverage gate), 531 frontend